
Whenever there’s a Google Algorithm Update, it’s normal to be scared and continuously check Google Search Console to validate that we don’t have a drop in rankings.
If you’re lucky, you may even see a significant improvement for your site, but there’s always a risk of losing organic rankings, and you’ll want to know which terms and pages have been affected.
So, if after a Google Update, your GSC data looks like this:
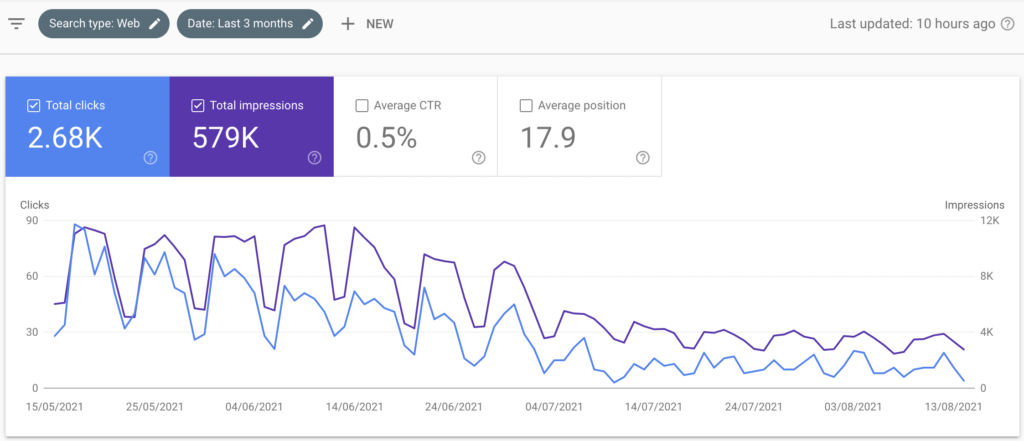
You’ll want to dig deeper and assess the drop in impressions, clicks and position at a query and page level.
I’ve developed a Google Sheet that you can copy and use during a post-Google Update assessment to facilitate that work.
You can access a live example of this Google Sheet and create a copy to use with your data.
[TOC]
Gathering the data
The first step is to go to GSC, select a 7-day date range before the identified decrease in rankings, and export that data into Google Sheets or Excel.

Select your data from the “Queries” tab of your exported file, go to the Google Sheets file, go to the Pre-Update Queries tab, select all the sheet range (by clicking on the left side of the A column and above the first row), and paste only the values.

Repeat this step with the data from the “Pages” tab of the exported file and paste it on the Pre-Update Pages tab.
Go back to GSC and select a 7-day date range from when you saw the decrease in clicks & impressions.
Paste the data from your “Queries” tab in the Post-Update Queries tab and the data from your “Pages” tab in the Post-Update Pages tab.
You can now go to the Insights tab and find a summary of all the things that this Google Sheets analyzes:

Clicks
In the clicks section, you can see how many queries lost clicks, the total clicks from before and after the update and the loss (or gain) of clicks.
Impressions
The impressions section shows how many queries lost impressions, the total impressions from before and after the update, and the impressions loss (or gain).
Lost terms
If there are any lost terms (terms that no longer appear in your post-update queries), you can see how many of them are and the impact of those lost terms from a clicks and impressions perspective.
Position
The position section shows the average position for all your pre-update and post-update terms and its difference.
Analyzing this is helpful to assess if you lost rankings or it’s just a seasonal change that’s reducing your impressions and clicks.
Pages that lost clicks
I also included a page-level analysis that analyzes the number of clicks per page before and after the update.
Pages that lost impressions
This section analyzes the change in impressions per page, similar to the “pages that lost clicks.”
You can find all the data from these insights in the following tabs that are described below:
Lost Terms tab
If there are any terms for which you didn’t get impressions and clicks in the post-update date range, they’ll appear here.
You can see each term’s clicks, impressions, and average position from the pre-update date range.
You’ll also find the lost terms’ insights here that summarize the loss of clicks and impressions from these terms.
You can quickly assess if these are important keywords for your site and double-check that you rank for it. Just because you didn’t get clicks & impressions in 7 days, it doesn’t mean that you lost rankings for that term; it could be a seasonality issue.

Loss of Clicks Tab
This tab gets all the queries’ clicks from the pre-update and post-update data and calculates the difference between them.
By default, the data is sorted by the number of pre-update clicks in descending order.
The difference in clicks column has conditional formatting to highlight in red terms that decreased clicks, yellow for terms that had no change in clicks, and green for terms that increased their clicks.

Loss of Impressions Tab
This tab gets all the queries’ impressions from the pre-update and post-update data and calculates the difference between them.
The data is sorted by the number of pre-update impressions in descending order.
The conditional formatting from the difference of impressions column highlights in red terms that lost impressions, in yellow terms that didn’t change its impressions, and green for terms that increased their impressions.

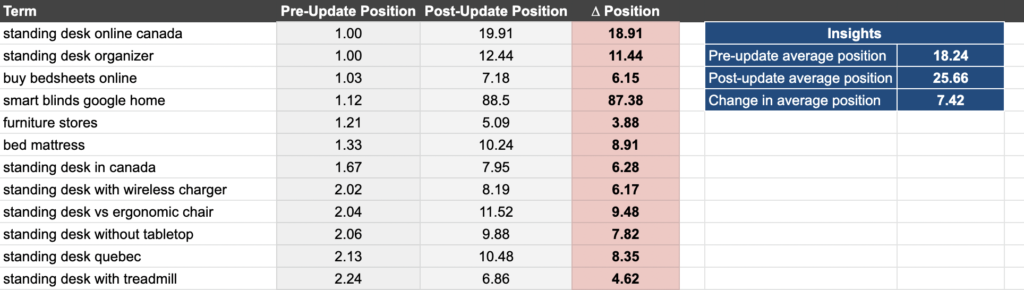
Loss of Position Tab
This tab gets the average position for each query in the pre-update and post-data data and calculates the difference between them.
You can then assess if a significant drop in the average position caused the loss of clicks & impressions.
Remember to double-check your rankings for the identified lost terms to make sure it’s not a seasonality issue.
The conditional formatting of the position difference column highlights in red the queries that decreased their position, in yellow for queries with minimal position fluctuations (between 0.1 and 0.9 change), and green for position increases.
Pages that Lost Clicks Tab
This tab gets the clicks for each page from the pre-update and post-update data and calculates the difference between them.
After you’ve analyzed the impact of the Google Update at a query level, it’s time to assess the impact at a page level.
You can easily identify which type of pages had a decrease/increase in clicks.
The conditional formatting of the clicks difference column highlights in red terms that decreased clicks, in yellow terms that didn’t change the number of clicks and green for terms with an increase in clicks.

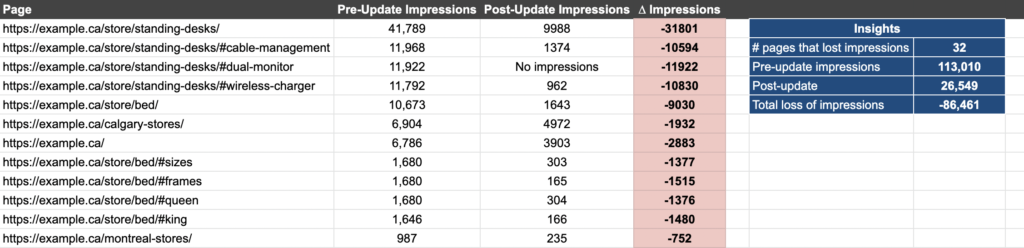
Pages that Lost Impressions Tab
This tab gets the impression data per page from before and after the update and calculates the difference between them.
You can assess the update’s impact from an impression perspective, considering that the selected date range could mean a seasonality drop in impressions & clicks.
The conditional formatting of the difference in impressions column highlights in red pages that lost impressions, in yellow terms that didn’t change their impressions, and in green for pages with increased impressions.
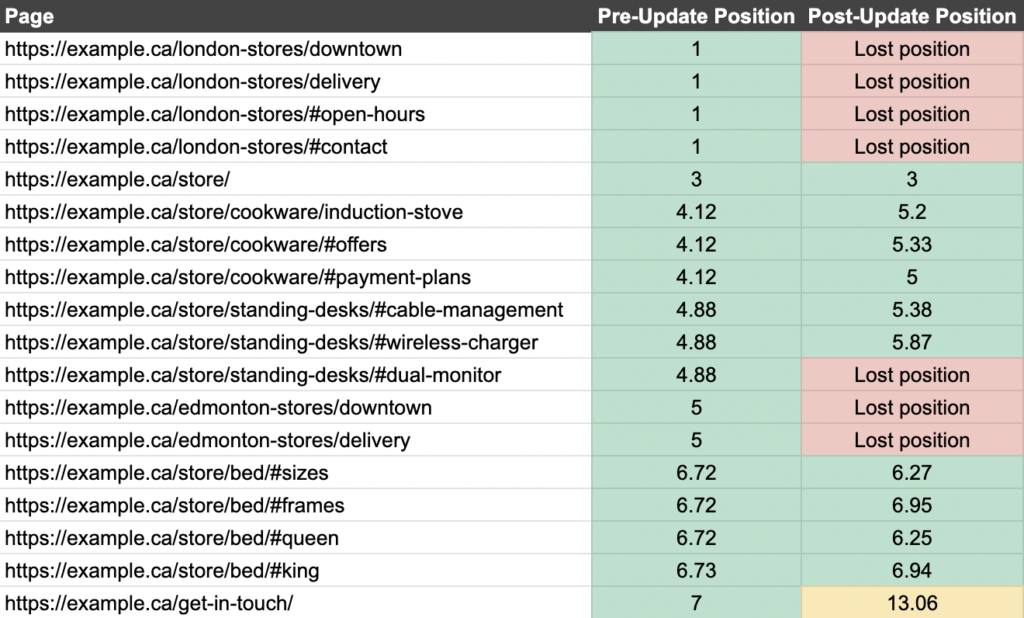
Pages that Lost Position Tab
This tab gets the average position for each page from before and after the update.
Each column has conditional formatting to highlight in green pages with an average position of 1 – 10.99, yellow for pages with an average position of 11-19.99 and red for pages with an average position of more than 20.
Even if this Google Sheet is meant to analyze the impact of a Google Update, you can use it to assess the loss of clicks & impressions due to a redesign, change of content or web structure, etc.
If you find this Google Sheet useful, share it on Twitter!

