
As you may know, Google already considers user experience to rank pages. Some of these signals validate whether a web page is mobile-friendly or if it’s secure.
In its mission to become more user-centric, Google has announced a new ranking factor that will be incorporated this year, 2021: Core Web Vitals.
These ranking signals are meant to evaluate a page’s loading speed, interactivity, and visual stability.
Let’s go through some key topics so you can start assessing and optimizing your website for these new Core Web Vitals:
[TOC]
What are the Core Web Vitals?
Page experience is a set of signals measured by Google to see if a page provides a good experience when a user visits it.
Some of these page experience signals are already taken into consideration to identify a “good page experience”:
- Mobile-friendliness: Whether your page is optimized for mobile devices.
- Safe-browsing: Absence of any malicious or misleading content (malware or phishing).
- HTTPS: Whether your site uses a valid SSL certificate to ensure an HTTPS connection.
- No intrusive interstitials: The page doesn’t have elements that obstruct its main content (such as a popup covering most of the content that shows immediately after a user enters the site)
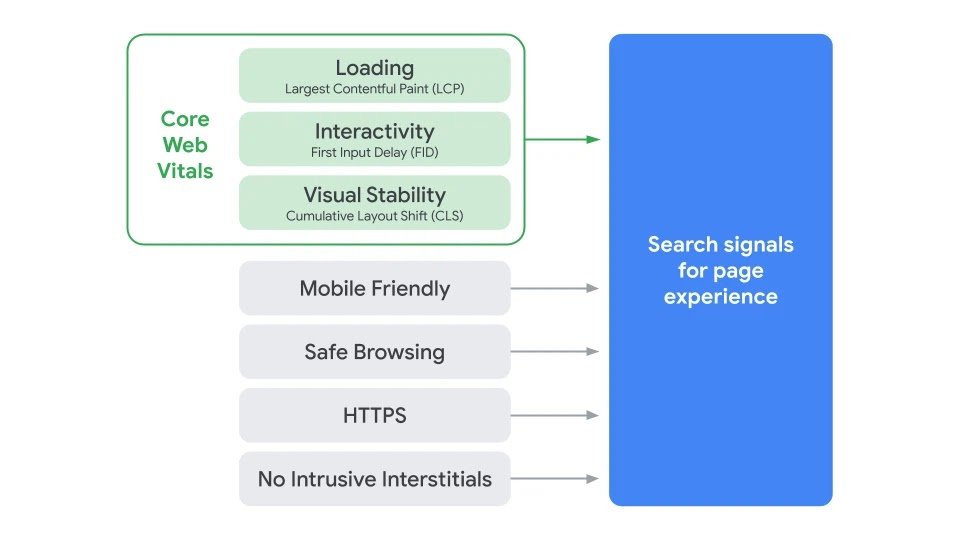
Page Experience Signals
In addition to this, Google is adding the Core Web Vitals that measure the page experience based on loading speed, interactivity, and visual stability.
The Core Web Vitals are expected to be introduced in May 2021 in an update.
As the graph shows, Google will use three metrics to measure these new page experience signals.
Largest Contentful Paint (LCP)
The Largest Contentful Paint (LCP) is used to measure page loading performance, i.e. how long it takes for a page to display the most important elements.
This doesn’t reflect the total loading speed of a certain page but rather the first “piece” of content that should be shown within 2.5 seconds according to Google’s standards.
To better understand this, let’s look at the loading timeline of Instagram.
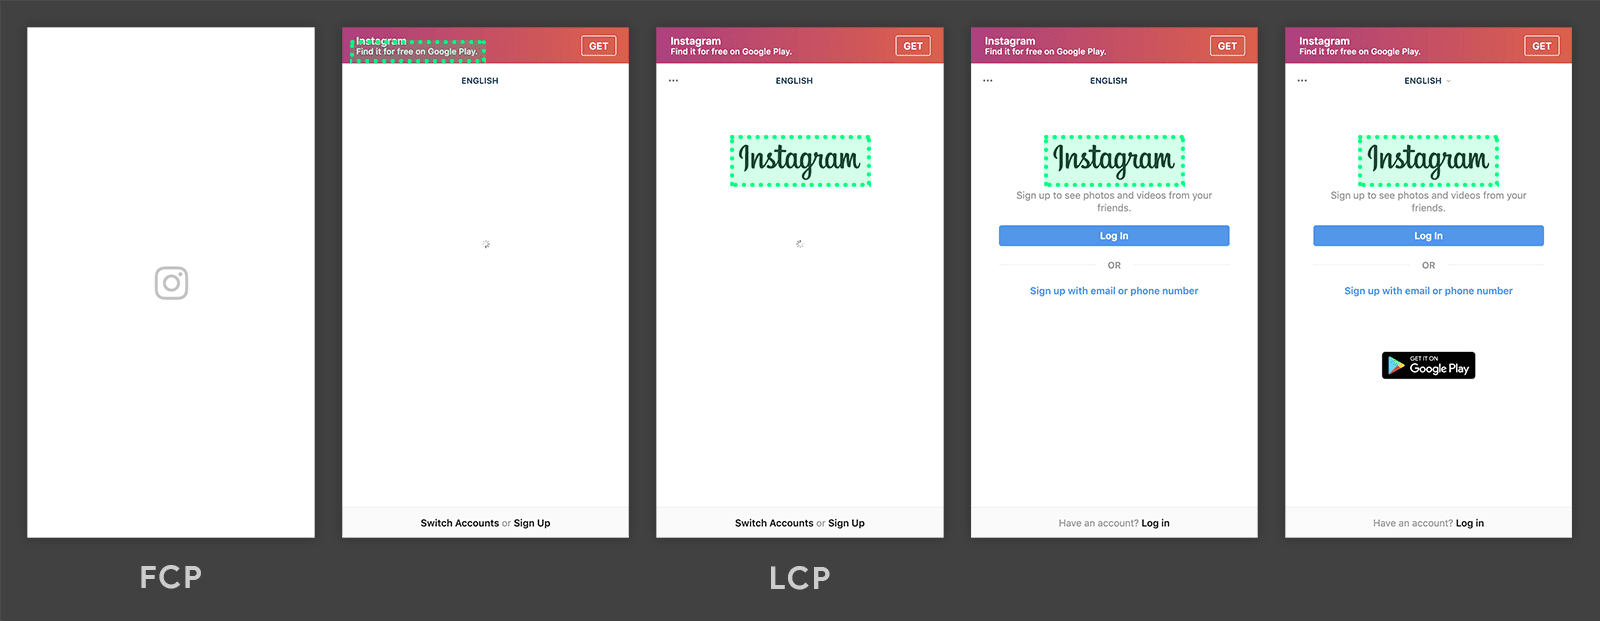
Instagram Loading Timeline
As you can see, LCP is reached once the logo is loaded, but the login button and other elements are “hidden”. This is because the logo is the largest element on that page, so the moment that it’s loaded, it’s the “LCP point”.
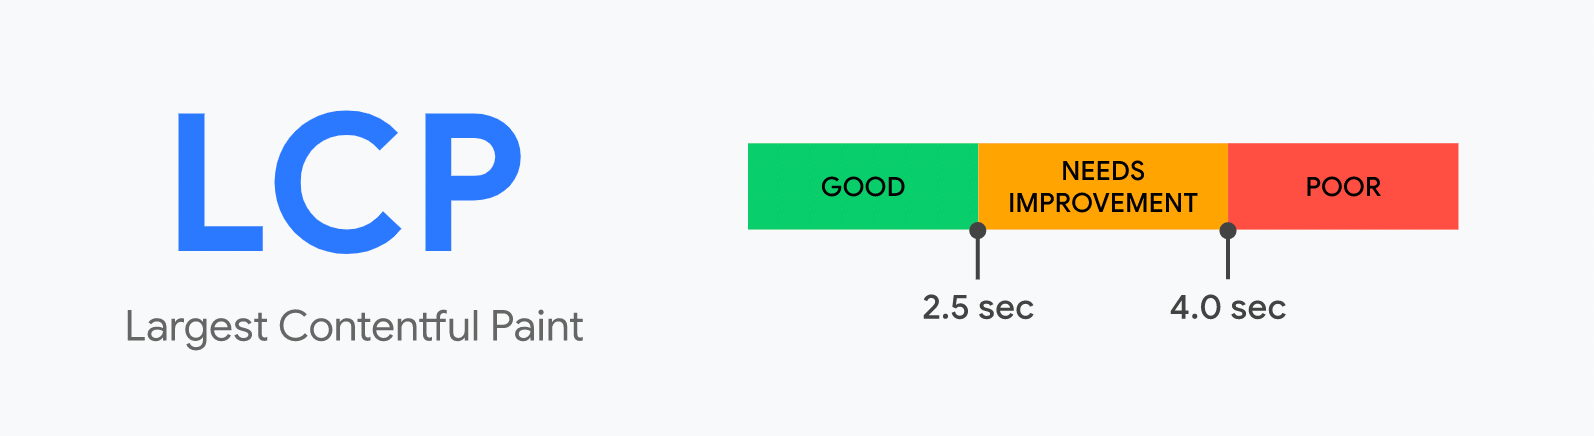
LCP Score by web.dev
First Input Delay (FID)
The First Input Delay (FID) measures the time between when a user first interacts with your website (like clicking on a button) and when the browser can respond to that interaction.
A good FID is when that interaction takes less than 100 milliseconds.
FID only measures the “delay” in event processing; it doesn’t measure the exact time it takes for that event to happen.
Scrolling and zooming are continuous actions that have completely different performance constraints, so don’t get confused.
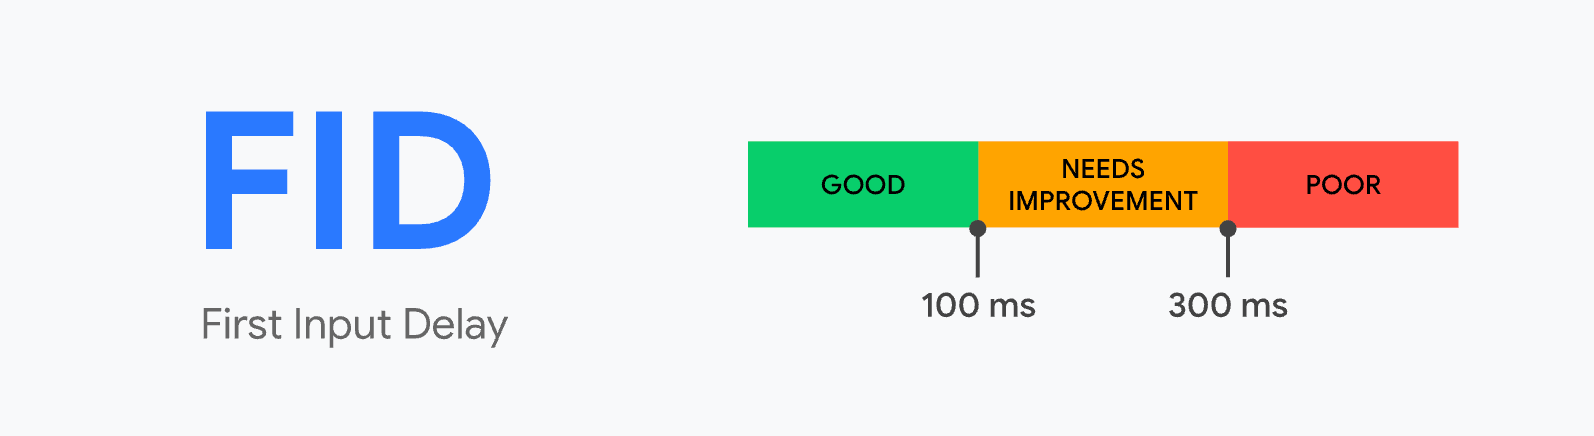
FID Score by web.dev
Cumulative Layout Shift (CLS)
The Cumulative Layout Shift (CLS) measures visual stability and frequency in which unexpected layout changes occur.
A visual change happens every time an element on your page changes its position unexpectedly.
I’m sure you’ve encountered with sites (mostly news sites) that an ad banner shows up in the middle of the screen when you are reading the content. This is a great (and annoying) example of a layout shift.
However, not all layout shifts are bad. A layout shift is only bad if the user isn’t expecting it.
This means that layout shifts that happen due to interactions like clicks on a button, typing in a search box, and similar, are fine as long as the shift occurs close enough to the interaction that the relationship between the interaction and the shift is clear.

Take a look at the previous image, the “Click Me!” button appears at the end of the gray box, which causes the gray box to change its size but not its position, so it can’t be considered an unstable element.
The “Click Me!” button wasn’t at the start of the DOM, so its initial position didn’t change either.
However, the start position of the green box does change, and it’s that element that affects your CLS score.
What happens with animations and transitions?
Many websites love the use of animations and transitions on their websites. The truth is that content that shifts abruptly and unexpectedly creates a bad user experience.
To avoid animations and transitions to impact your CLS negatively, use the CSS transform property to animate elements without triggering layout shifts.
Commonly, websites use properties like height or width to use animations and transitions. However, using transform: scale() to change the size it’s better.
Similarly, instead of using top, right, bottom, and left attributes to change the position of an element, use transform: translate() instead.

CLS Score by web.dev
Measuring your Core Web Vitals
There are many extensions and tools out there that can help you to measure your website’s Core Web Vitals.
I will show you some of the tools and extensions that I’ve tested myself, but if you want to know more, you can check out Aleyda’s tweet in which she shares some useful free tools to do it.
Are you doing Speed & Core Web Vitals analysis? To prioritize actions w/ clients I've found useful to do competitive speed & CWV analysis to show its importance and impact vs. other player for meaningful queries!
Here's a thread about how to do it w/ free tools ⚡️🛠
— Aleyda Solis 🕊️ (@aleyda) December 11, 2020
Core SERP Vitals
Core SERP Vitals‘ extension is a little bit more complex to set up than the previous one but nothing to worry about. After installing it, you’ll be taken to the Settings Page, in which you’ll need to obtain and enter a Chrome UX Report API Key and choose the device for which the metric data will be shown.
After it’s installed and configured, you can do a normal Google search (like one of your website’s most important keywords), and you will see the score of each metric in the SERP results.
However, this extension won’t show results for every page but only for pages with existing data in the CrUX report.

Lighthouse
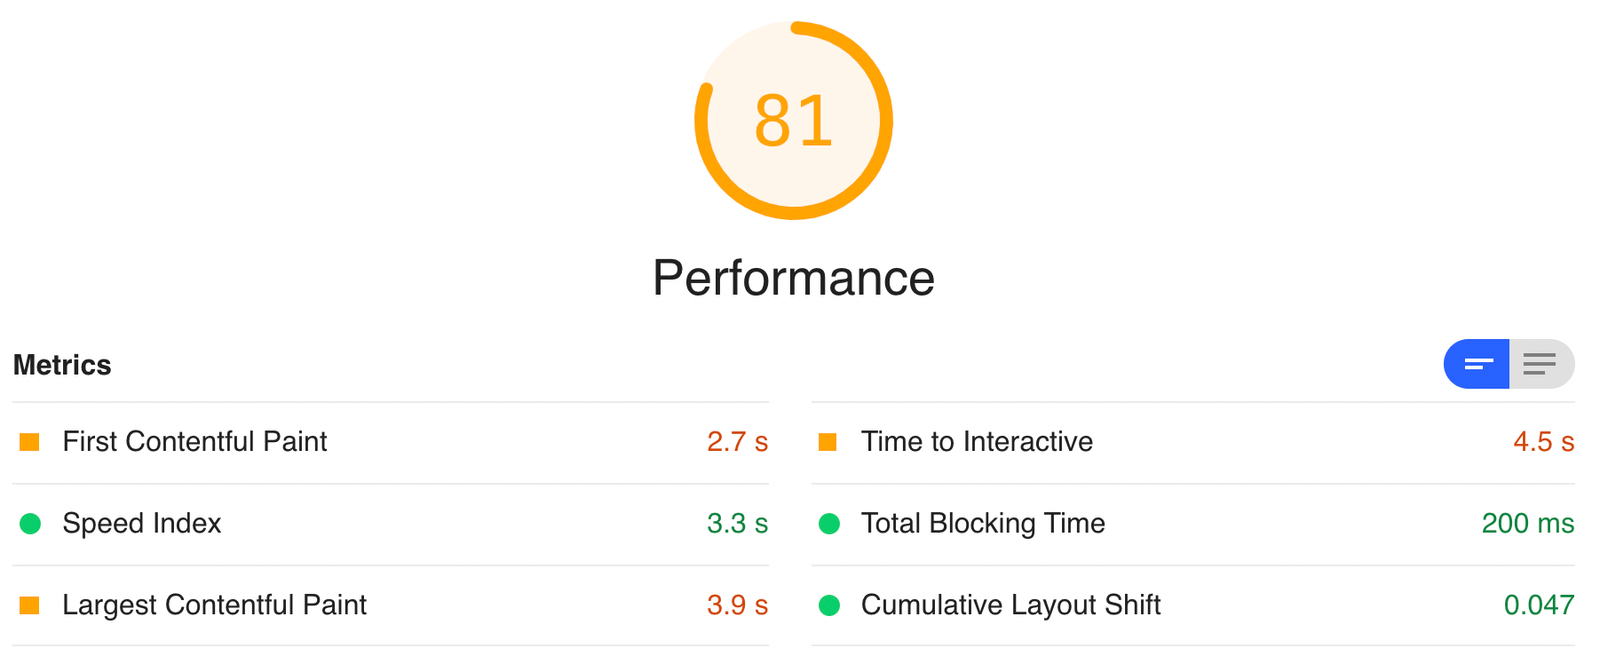
Using the Lighthouse extension, you can generate a report for your website in which you can see scores for areas like SEO, Performance, Accessibility, Progressive Web Apps, and more.
The report shows in the performance section the values of different metrics, including the Core Web Vitals.
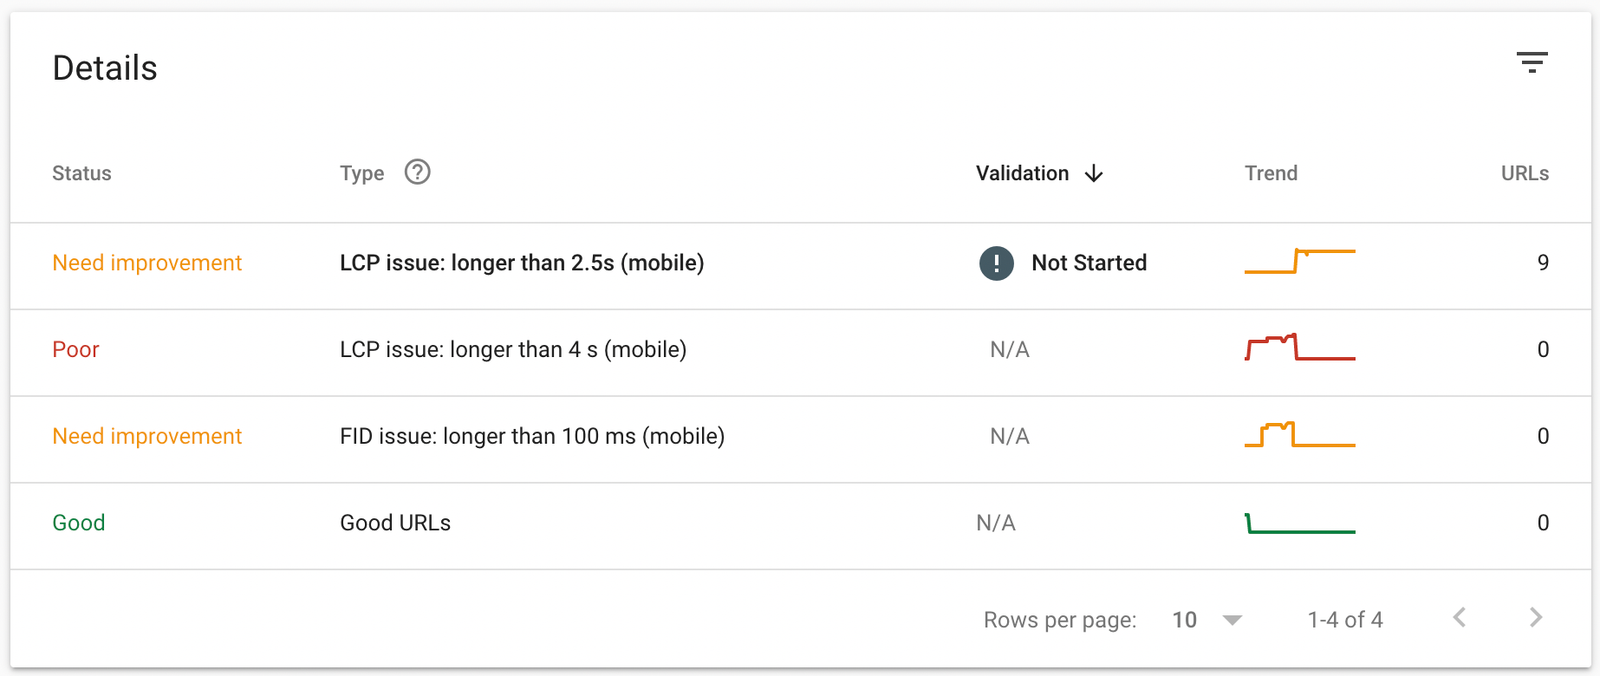
Core Web Vitals in Search Console
A Core Web Vitals report is also available in Google Search Console; it may not be available on your website if it’s very new or there isn’t enough data available, but if your website has this report available, you can easily see the affected URLs and issue that they have so you can optimize them.

Optimizing your website’s Core Web Vitals
With the data gathered from the tools listed above, the big question is “How do I fix these issues?“.
There’s no standard recipe for optimizing these metrics because different factors can affect your website’s Core Web Vitals. Hence, the better way to approach this is to review the data and suggestions that some of these tools offer so you can know where to start fixing/optimizing.
Optimizing Largest Contentful Paint (LCP)
By reducing your server’s response, you can normally ensure that your largest element is loaded sooner. However, render-blocking resources like JS and CSS can seriously impact your LCP.
Try minifying your CSS and JS files, use inline stiles whenever possible (normally with small custom tweaks in CSS but not with the entire website’s CSS styles), defer the execution of <script> tags unless the script manipulates the DOM or if it depends on other scripts.
Use compressed images, limit their size to 100 MB, use lazyloading. If possible, use CDN’s so they can be loaded faster. Try to use new generation images like WebP or JPEG 2000 (keep in mind that not all browsers are compatible with those formats).
Optimizing First Input Delay (FID)
Again, minify and compress your JS files, defer any scripts that aren’t essential for the website’s main visualization.
Remove unused CSS and JS. Many WordPress websites use plugins for contact forms, sliders, etc., which are loaded on every page, and most of them don’t need those resources. So it’s also important to assess if the resources loaded on the page are actually used.
TL;DR: Keep the number of requests low and transfer sizes small.
Optimizing Cumulative Layout Shift (CLS)
Instead of adjusting the size of images in your CSS, make sure that their proper dimensions are specified with the width and height attributes of the <img> tag.
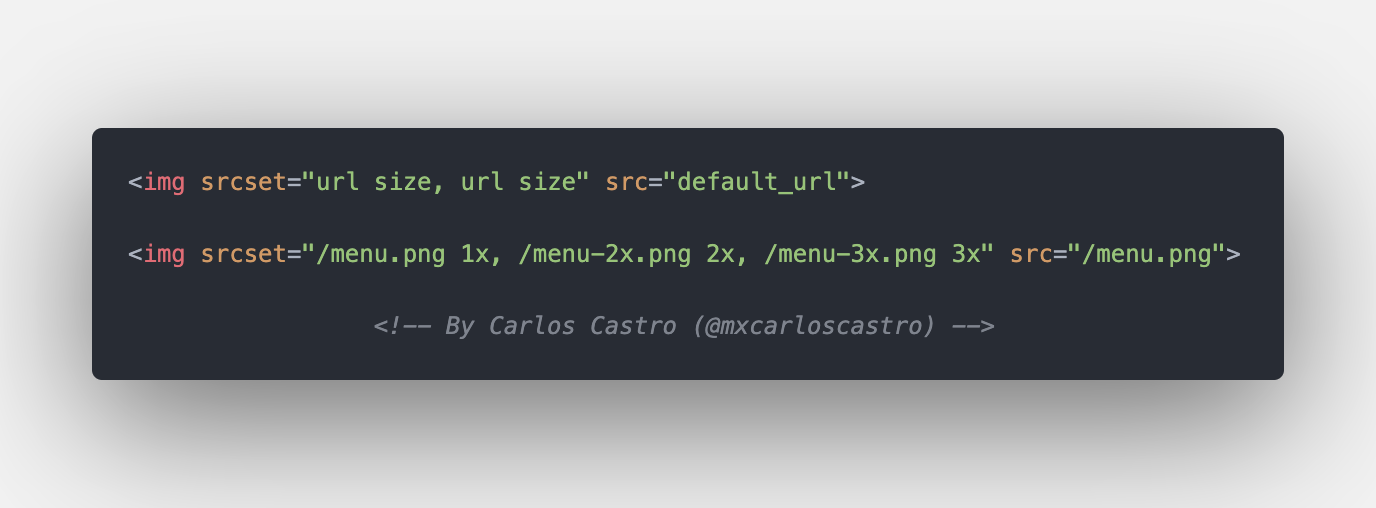
If possible, use different sized images for mobile and desktop (if sizes vary in these two devices) and specify the proper image file in the srcset attribute according to the device’s width. See an example below:
Test every change
It’s fundamental that every change and fix you make it’s previously tested. Maybe when deferring the load of a certain <script> an important functionality or element is not correctly displayed, so you’ll have to try deferring another non-essential script.
You don’t want to publish a live version of your site that isn’t working as expected.

